
Most SEOs (Search Engine Optimisers) have Chrome open all day, yet few stop to check what the Google Developer Tools suite inside it can really do.
In fact, Google Chrome holds 64.86% of the global browser market, and most people browsing in it have no idea Chrome DevTools is sitting right there.
At Matter Solutions, Chrome DevTools goes into every technical SEO audit we run. In this article, we’ll cover:
- The top seven Chrome DevTools panels for SEO
- How each panel helps you find and fix real issues on your site
- How to use Chrome DevTools MCP for advanced SEO research
- Tips on core web vitals, page loading, and indexing checks
Keep reading, and we will walk you through each one.
Google Developer Tools SEO: What Most Marketers Miss
Chrome DevTools is a free, built-in browser suite that gives SEOs direct access to the rendered page Google evaluates. It ships inside every Chrome installation, and costs nothing to use.
Here is what the seven panels cover:
We see most teams open Ahrefs or Screaming Frog before Chrome DevTools gets a second thought, so it’s usually skipped even on full technical SEO audits.
However, those tools pull information directly from the website’s source code. In contrast, Chrome DevTools can read the live rendered Document Object Model (DOM). This is the version of the page that users and search engines process.
To give you a perspective, web applications built on frameworks like React or Vue can look fully loaded in a browser yet serve a near-empty page to a crawler. But Chrome DevTools shows you the same view Google sees, so rendering gaps get caught well before they cut into your search results.
Now, we’ll discuss all these panels, including what they do, how they work, and when developers use them during testing and debugging.
The Elements Panel: Canonical Tags, Structured Data, and Meta Robots
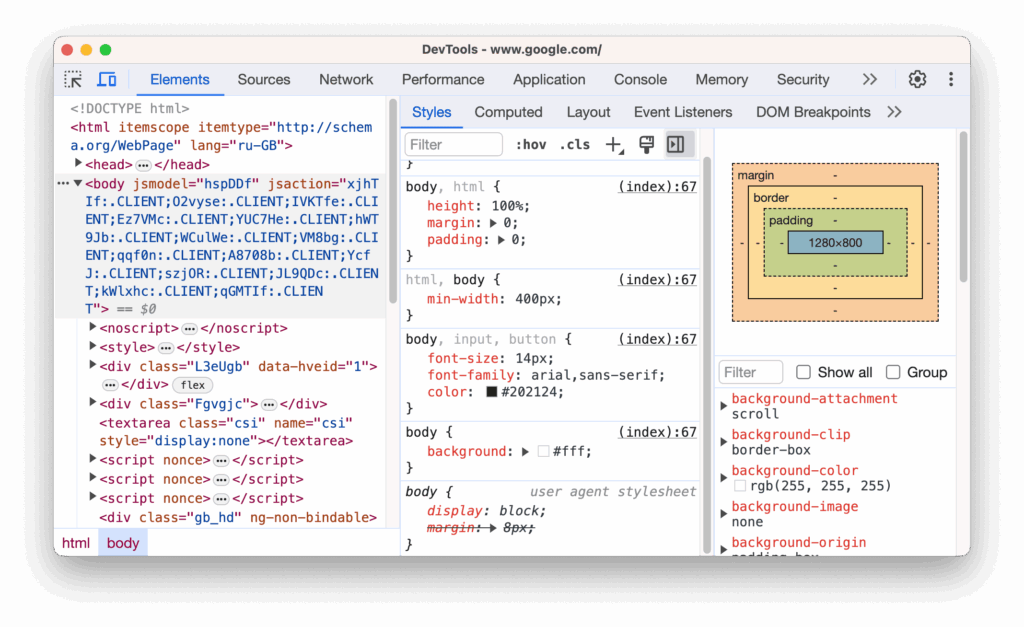
The Elements panel gives you a full view of your rendered on-page SEO signals without opening a single external tool. Simply right-click any page in Chrome, hit Inspect, and every element Google reads is right in front of you.
From there, you can check four signals in one place:
- Canonical Tag Verification: Find the canonical URL by searching “canonical” in the Elements panel. This confirms that it points to the correct page and has not been overridden by a plugin or JavaScript.
- Meta Robots Tag Status: A single search for “robots” in the panel reveals whether a page contains directives like noindex or nofollow. On large CMS-driven websites, this can immediately uncover mistakes like important landing pages being blocked from appearing in Google search results.
- Structured Data Code Snippet: Snippets make it easier to validate features like FAQ schema, review stars, or product information before deployment. You can copy the code snippet directly and run it through Google’s Rich Results Test without leaving Chrome.
- Live Title Text and Meta Description Editing: This edit is useful for testing keyword placement, checking readability, or seeing how shorter titles might appear in search results. For this, double-click title tags or meta descriptions in the browser to preview edits instantly without touching the live codebase.
What you see in the Elements panel isn’t the source code, though. It’s the live, JavaScript-rendered HTML your browser builds after the page loads, and that’s what Google processes during a search crawl. So if your sites are running JavaScript-heavy frameworks, this check should be part of your regular audit workflow.
Network Panel: HTTP Status Codes, Redirects, and What They Cost You
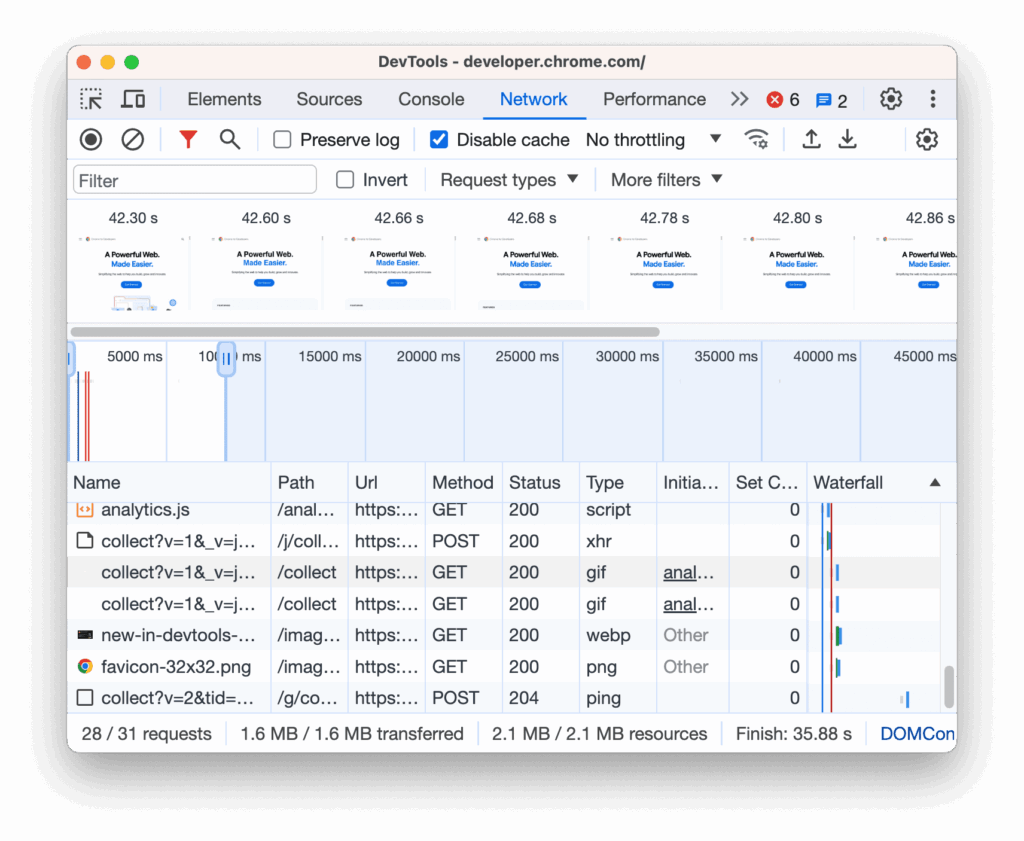
A single redirect chain can drain a page’s authority and eat into crawl budget, yet most SEOs never spot it without the Network panel. When you open Chrome DevTools, hit the Network tab, and reload the page, every network request your browser makes is logged instantly.
What you get is a full list of resources, each tagged with a URL, status code, file size, and load time. This is how to read them.
Reading HTTP Status Codes for SEO
Each status code in the Network panel carries a specific meaning, and reading them right saves hours of guesswork. Take a look at what the 5 most common ones tell you:
- 200 OK: This status confirms the page loaded successfully and the server delivered the content without errors, which is what both users and search engines expect to see.
- 301 Moved Permanently: A 301 redirect helps preserve rankings and direct visitors to the correct destination automatically. It tells browsers and Google that a page has permanently moved to a new URL.
- 302 Found: Unlike a 301, a 302 signals a temporary redirect. This is useful during short-term changes or testing, but using it incorrectly can confuse search engines about which page should rank.
- 404 Not Found: Too many broken pages can create a poor user experience and waste search engine crawl activity. A 404 error appears when a page no longer exists, or the URL is incorrect.
- 503 Service Unavailable: This response means the server is temporarily unable to handle requests, often during maintenance or traffic spikes. If it happens repeatedly, Google may reduce how frequently it crawls the site.
Pro Tip: Filter the Network panel by document type to isolate page-level requests, rather than sorting through every image, script, and stylesheet loading on the page. It sorts everything conveniently and speeds up your SEO analysis.
How Redirect Chains Drain Crawl Budget and Link Equity
Redirect chains silently build up on sites that have been live for several years, and the Network panel can make them visible in under 2 minutes. Each redirect shows up as a separate row with its own status code.
As a result, a 3-hop redirect chain may show a page going through several steps before it fully loads. For example, the site might first redirect visitors from HTTP to the secure HTTPS version.
It may then redirect from the non-www version (example.com) to the www version (www.example.com) before finally returning a 200 OK status. This means the page loaded successfully.
From what we’ve seen across client projects, chains built on 302s are particularly costly. Google treats each hop as a signal to re-evaluate the destination, and link equity from inbound URLs thins out with every additional redirect in the chain.
To trace a full redirect path, type the original URL into Chrome, open the Network panel before hitting enter, and watch the sequential network requests resolve one by one.
After that, verify the final destination carries a 200 response and that the HTTPS URL matches your canonical.
Lighthouse: The Built-In SEO Audit Tool You’re Probably Not Using
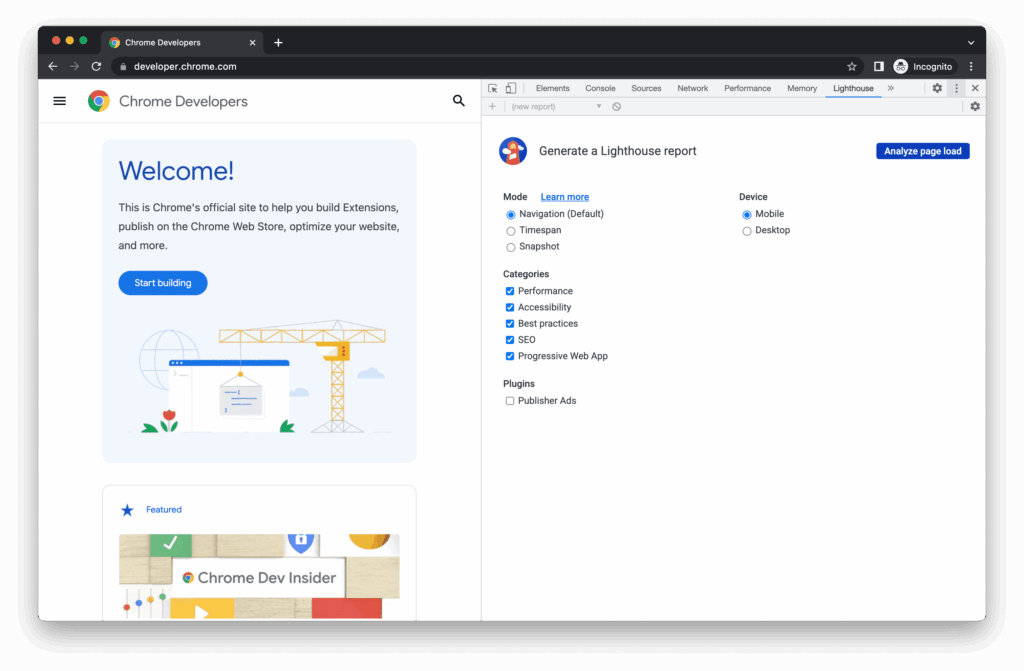
Lighthouse runs a full SEO audit from inside Chrome, scoring your page out of 100 across mobile-friendliness, crawlability, and meta tag accuracy. It sits inside Chrome DevTools under its own tab.
Here is what Lighthouse checks under its SEO category:
- Mobile Friendliness Check: Lighthouse tests whether the page renders correctly on mobile viewports. For example, it flags font sizes below 12px, tap targets under 48px, and content wider than the screen.
- Page Title Verification: Missing, duplicated, or overly long title tags are flagged automatically. This way, it’s easier to spot pages that may struggle to stand out in Google search listings.
- Meta Description Audit: Missing or truncated descriptions affect click-through rates in search results. That’s why it checks whether a meta description exists and falls within Google’s recommended character range.
- Crawlability and Indexing Signals: Lighthouse reviews technical SEO signals such as robots directives, canonical tags, and robots.txt rules. These checks help identify anything that could prevent search engines from properly accessing or indexing the page.
- Structured Data Validation: Lighthouse flags invalid or incomplete schema.org standards. For this reason, you can identify why rich search features like review stars, FAQs, or product snippets may not be appearing in Google results.
- Link and Tap Target Analysis: Button spacing, touch target size, and anchor text all affect navigation on mobile screens. So you can use this tool to spot these issues more easily.
These checks give you a fast, reliable baseline across the signals that are most essential for Google search performance. For SEO insights beyond the basics, pair the Lighthouse SEO report with the Elements panel to cross-reference what the audit flags against the live rendered HTML.
Performance Panel: Reading LCP, INP, and CLS in the Performance Timeline
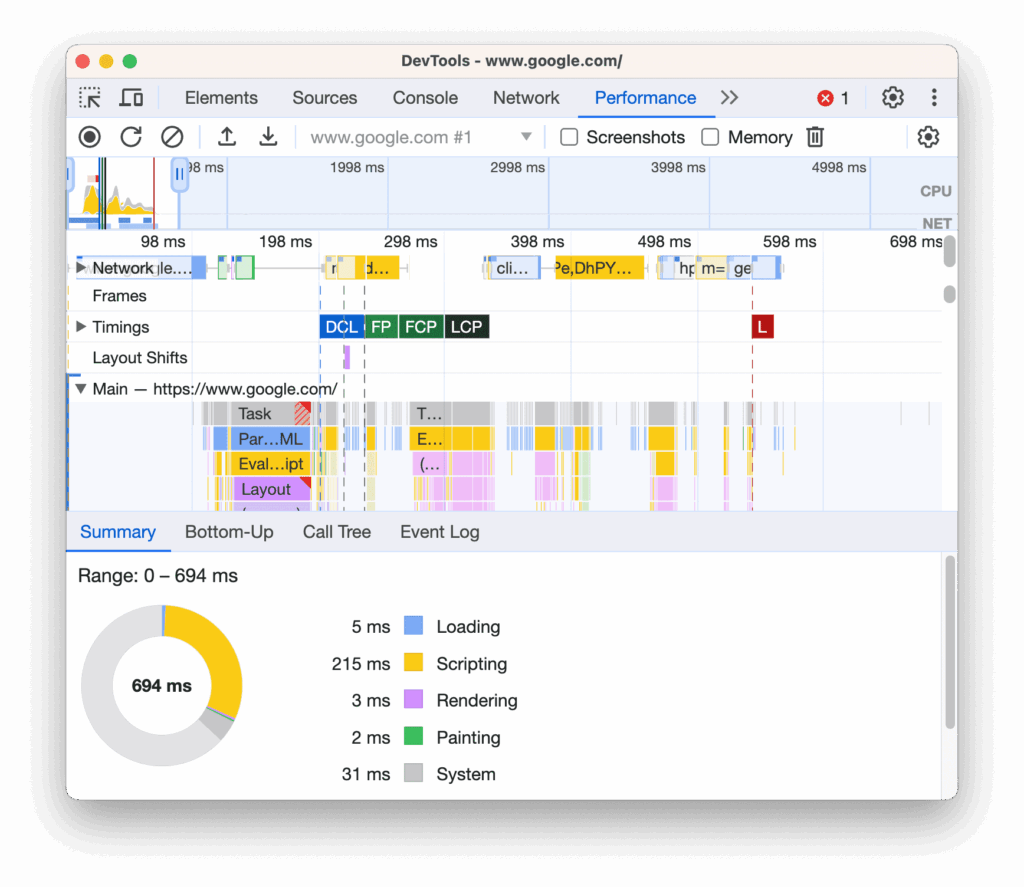
A score of 90 on Lighthouse still does not tell you which script is delaying your LCP. Fortunately, the Performance panel does, and it goes several layers deeper than any summary score can. To enable it, open it in Chrome DevTools, hit the record button, reload the page, and a full visual timeline of every page loading event builds itself out in real time.
You’ll see Core Web Vitals show up as markers directly on the Performance panel timeline, with each one pointing to a specific moment in the page load sequence. That precision is what separates this panel from Lighthouse, which gives you a score without showing you the exact frame where things went wrong.
Let’s see how each of the three core web vitals appears in the timeline and what to look for:
| Core Web Vitals | What It Measures | Where It Shows in the Timeline |
| Largest Contentful Paint (LCP) | Time for the largest visible element to load | Marked as a red line; anything over 2.5 seconds needs attention |
| Interaction to Next Paint (INP) | Responsiveness of the page to user interactions | Appears under interaction events; target is under 200ms |
| Cumulative Layout Shift (CLS) | Visual stability as the page loads | Shows as layout shift events; a score above 0.1 indicates a problem |
Beyond core web vitals, the Performance panel also surfaces performance insights like memory leaks, JavaScript execution tasks over 50ms, and render-blocking resources. We suggest analysing the flame chart at the bottom of the panel to pinpoint which specific functions are consuming the most processing time.
In the case of teams monitoring multiple sites, running a Performance panel recording alongside a Lighthouse audit gives you full insight. Basically, it flags what is wrong, and the Performance panel shows you where in the load sequence it is happening.
Application Panel: Service Workers, Caching, and How They Affect What Google Crawls
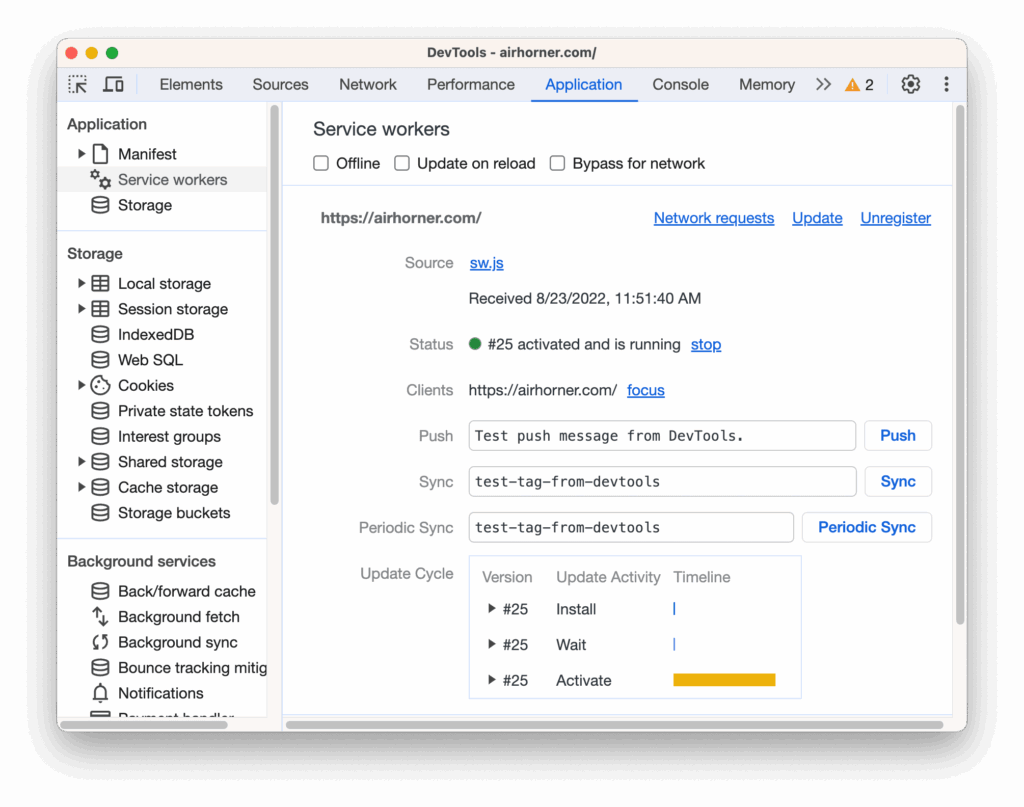
A page can look perfectly fine in the user’s browser and still serve Google a cached version from 3 weeks ago. That’s where the problem usually starts, and the Application panel in Chrome DevTools is where you go to find it.
The Application panel gives you direct access to verify three things that affect what Google crawls and indexes on any web page:
- Service Worker Status: You can check whether a service worker is active, waiting, or redundant in the Service Workers section. It’s important because an active worker intercepting requests can override your latest content and block Google from seeing your real meta robots tag directives.
- Cache Storage Analysis: Cached files, saved URLs, and stored page resources can all be reviewed inside the Cache Storage panel. This makes it easier to spot outdated versions that no longer match the live site.
- Clear Storage Tool: When you need a completely fresh test environment, the Clear Storage option removes cached data, cookies, and service workers in a single step. This way, the browser reloads the newest version of the page.
Running these checks after every significant content update takes under 5 minutes and removes one of the more overlooked sources of indexing delays. For web applications built on progressive web app frameworks, this check is worth adding to your standard deploy process.
Chrome DevTools MCP: The Newest Tool in Your SEO Stack
DevTools MCP is the latest addition to Chrome’s SEO toolkit, and it connects Chrome DevTools to AI agents for automated research at scale (something none of the other panels can do). It’s a great help for SEO teams managing large sites or running competitive analysis across dozens of URLs at once.
This Model Context Protocol (MCP) works by exposing Chrome DevTools functionality to external AI tools like Cursor. From there, an AI agent can browse pages, analyse search results, and monitor site performance across hundreds of pages without manual input. For SEO professionals handling technical SEO at scale, that kind of ability cuts research time down significantly.
Beyond bulk analysis, Chrome DevTools MCP also opens up competitive research. You need to point the AI agent at a competitor’s search results pages for that. It can then extract content patterns, heading structures, and code snippets from their top-ranking pages within minutes.
That kind of search analysis used to require expensive enterprise tools, and now it runs from inside Chrome.
Console Panel: How Console Errors Connect to Your Google Search Console Data
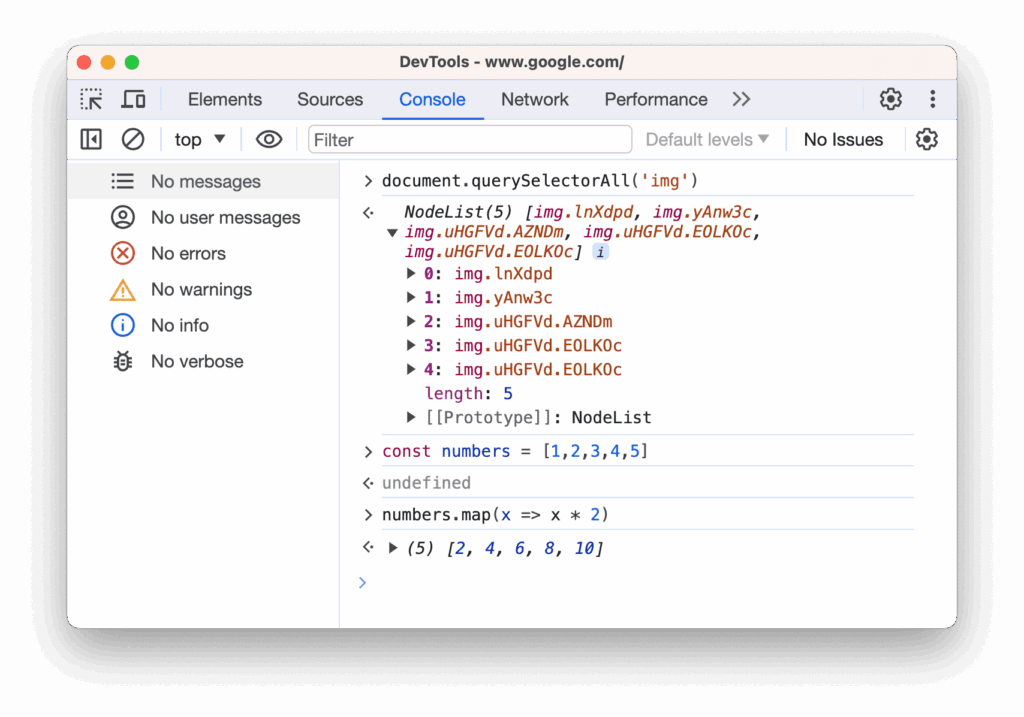
Fix the right JavaScript errors, and you can recover content that Googlebot was never able to see in the first place. The Console panel in Chrome DevTools is where those errors appear. It is one of the most direct ways to verify what is actually rendering on a page, for developers and SEO professionals alike.
You can use the Console panel alongside Google Search Console to track down the root cause of these common SEO issues:
- Coverage Errors and JS Failures: When Google Search Console flags a page as crawled but not indexed, open that URL in Chrome DevTools. From there, check the Console for JS errors blocking content from rendering. Search Console shows the symptom, and the Console panel identifies the cause.
- Structured Data Dropouts: If rich snippets disappear from Google search results without an obvious reason, a JS error breaking the structured data code is often behind it. In this case, cross-reference the Console output with the Lighthouse SEO report to verify the structured data block is rendering correctly.
- Search Console Enhancement Failures: Enhancements flagged as invalid in Google Search Console often trace back to a JS error visible in the Console panel. You can simply analyse the error message, find the relevant code snippet, and fix the source rather than patching the symptom.
- Missing Page Elements in Google Search: Sometimes a page title, meta description, or body content shows incorrectly in search results. At that time, the Console panel helps identify whether a JavaScript execution error is overwriting the correct HTML before Google can read it.
To detect these, open the Console tab in Chrome DevTools and load any URL. You’ll see every JavaScript error, warning, and network request failure log instantly.
After years of working with technical SEO audits, red errors are the ones that are the most important for SEO. Because they indicate broken functionality that can stop entire page elements from rendering for search engines.
Your Browser Already Has Everything You Need for SEO
Every panel covered in this article is free, already installed, and ready to use the next time you open Chrome. Most teams build stronger audit workflows from the ground up once they realise how much is sitting right inside their browser.
The 7 panels work best when used together, though. So,
- Start with Lighthouse to get a scored baseline across your site
- Then move to the Elements panel to verify what Google sees at the page level
- Use the Performance panel to dig into any core web vitals issues the audit surfaces
That 3-step sequence alone covers the majority of what a standard technical SEO audit flags on most sites.
At Matter Solutions, we use Chrome DevTools as part of every technical SEO audit we conduct for clients across Australia. If your site has performance issues, indexing gaps, or search results that do not reflect your actual content quality, we can help you find and fix them straight away.
Get in touch with our team, and we will take a look.
Frequently Asked Questions About Chrome DevTools for SEO
Now that you know which panels to use and why, here are the most common questions SEOs ask when getting started with Chrome DevTools.
How to Use Chrome DevTools for SEO?
Press F12 in Google Chrome to open Chrome DevTools, then start with the Elements panel to check your meta description, page title, and canonical tags. It opens docked to your browser window, and you can switch between panels using the tabs along the top of the interface.
Which Panel Should I Start With for SEO?
Start with the Elements panel for on-page checks and Lighthouse for a scored SEO audit. Those 2 panels together surface the majority of issues that come up in a standard technical SEO audit. For example, you can find out missing meta descriptions, page title problems, and crawlability signals that affect Google search performance.
How Does Chrome DevTools Help With Core Web Vitals?
The Performance panel tracks core web vitals directly on a visual timeline, with markers for Largest Contentful Paint, Interaction to Next Paint, and Cumulative Layout Shift. Each marker pinpoints the exact moment a metric fires during a page load, so you can monitor and fix issues at the source.
Can I Use Chrome DevTools Without Technical Skills?
The Elements panel, Lighthouse, and Application panel all surface useful SEO data without writing a single line of code. In this situation, the Performance panel and Console involve reading more detailed data outputs.
However, pairing Chrome DevTools with Google Search Console makes most findings straightforward to interpret for non-technical users.
Need help with your digital marketing?
Book a free strategy call and let's discuss your goals.
Book a Strategy Call